|
|
|
|
|
|
Market Update
By Morgan Christen
CFA, CFP, CDFA, MBA, CEO and CIO
Hello,
I sit looking 'round
I look at my face in the mirror
I know I'm worth nothing without you
And like one and one don't make two
One and one make one
And I'm looking for that free ride to me
I'm looking for you
The Who - Bargain
|
|
 |
|
I am looking at the market and I am looking for you. Those that took the free ride are now through. What happened in September? To name a few; Starbucks Pumpkin Spice Lattes, football, and school. Two out of those three - football and school - could be responsible for the summer free ride.
Time to get back to your day job, whether that is a student or gambler. Sure, the Fed and the governments largesse has helped propel the markets... do not fight the Fed.
|
|
|
|
But thanks to the growth of commission-free trading and fractional share ownership, the retail investors now account for 20% of equity trading. Retail traders were major buyers of call options (the right to buy a certain stock at a certain price in the future). These options were notable in a select few stocks that have had stratospheric climbs.
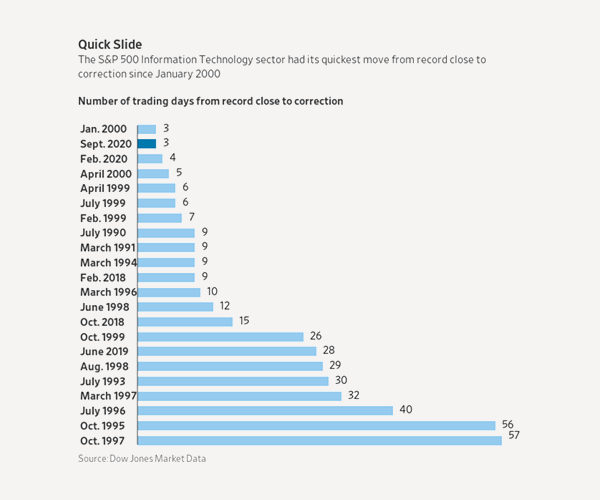
No sports to bet on? Fine, they will take the 'over' on TSLA. With the gamblers and students back at their day jobs, the S&P 500 started off September with the quickest correction (10% down) since 2000.
|
|
 |
|
|
|
Top Stocks
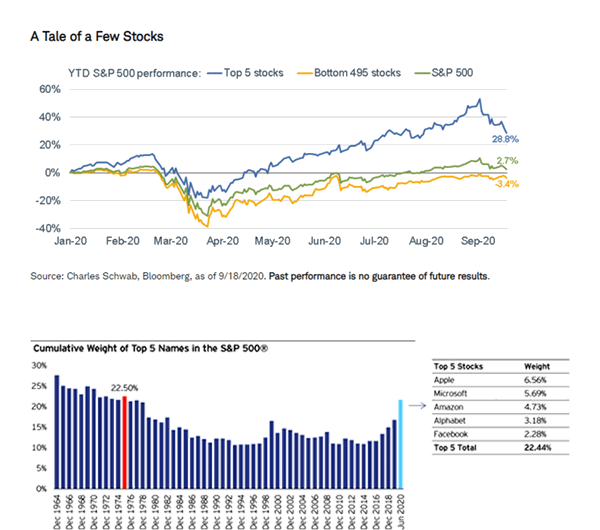
Those on the "free ride" have pushed a few stocks to new heights. The tale below shows the real market return. If it were not for 5 top stocks in the S&P 500, things would look different.
|
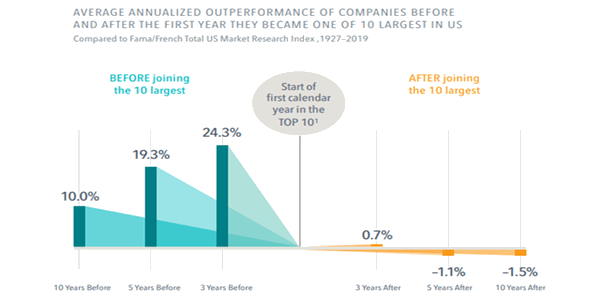
In fact, were it not for those top five, the S&P would be almost flat. The spread between the stocks is rather large. Everything in life comes back to average, as nothing can go up forever. Will the top stocks continue to lead, possibly, but most likely not over the long-term.
|
|
|
|
|
Source: Bloomberg. For illustrative purposes only. It is it not possible to invest directly in an index, and these hypothetical returns are not meant to imply the expected returns for an individual investor. Past performance is no guarantee of future results.
|
|
|
|
|
Source: S&P Global and Bloomberg, L.P., as of Aug. 7, 2020. In 1975, the top 5 holdings were IBM, Proctor & Gamble, Exxon Mobil, 3M, and General Electric. An investment cannot be made directly into an index. Holdings are subject to change and are not buy/sell recommendations.
|
|
|
|
Stocks
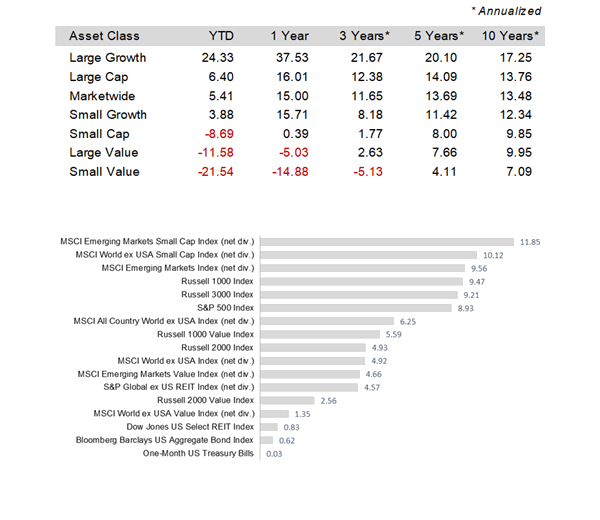
Stocks had a nice quarter with the larger growth type stocks posting gains even with the disappointing beginning to September.
|
Value stocks continue to claw their way back for the year. Investors went beyond the US border in the third quarter as emerging markets log the top spot.
|
|
|
|
|
|
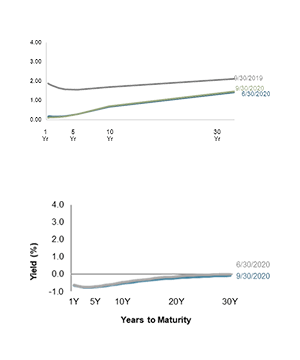
Bonds
The U.S. Treasury yield curve did not move from the prior quarter. Rates remain low with the 5-year note trading at a yield of 0.31% followed by the 10-year at 0.64% and the 30-year note at 1.46%. Good for mortgage holders, bad for those with bank savings accounts.
As bad as those rates appear, at least we are not Germany. German bondholders need to go out 20 years to get positive rates.
|
|
 |
|
|
|
 |
Elections
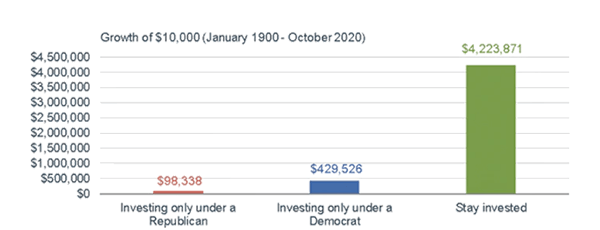
This is obviously a hot topic, as there are plenty of "what if" scenarios. Below are actual outcomes from Investing in your "team" versus staying invested in the market. We deliver this to show that just like most noise in the markets, it is generally good to avoid making decisions based on conjecture.
There is concern with a blue wave, Democratic President and Democratic Congress. The market since 1901 has averaged 7.2% during that scenario, and that scenario has happened 33.4% of the time. To compare with a Republican President and Republican Congress, that has happened 23.5% of the time with an average return of 7.3%. Negligible difference.
The best annual gain comes from the scenario of a Democratic President and a Split Congress with a return of 10.4% per annum. Problem with that scenario is that it only happens 3.4% of the time, and it was just the four years during the Obama administration from January 2011 - January 2015.
|
|
|
|
|
|
Source: Charles Schwab, Bloomberg, as of 10/2/2020. For illustrative purposes only. The above chart shows what a hypothetical portfolio value would be if a hypothetical investor invested $10,000 in a portfolio that tracks the Dow Jones Industrial Average on 1/1/1900 under three different scenarios: a Republican presidential administration; a Democratic presidential administration; or staying invested in the market throughout the entire period noted. Chart does not reflect effects of fees, expenses or taxes.
|
|
|
|
Conclusion
Bill Dodds was quoted as saying "Labor Day is a glorious holiday because your child will be going back to school the next day. It would have been called Independence Day, but that name was already taken."
So, as we begin October, which can be a tough month, did we get our independence from the retail gambler? Are we back to rational long-term investors?
November will come and go, markets adapt, and investors adapt; we suggest investors should not materially adjust their portfolios based on market prognostications. Does one and one make three?

|
|
 |
|
|
|
Have You Taken
The SpinnCycle™?
A quick reality check for your portfolio
Enter the SpinnCycle and find your SpinnScore™
|

|
|
|
|
|
Spinnaker Mobile App now Available for IOS and Android
|


|
|
|
|

Spinnaker Investment Group is a boutique, family-owned investment advisory firm that helps each investor design, implement and run a portfolio. We work directly with each client to help them realize their financial independence.
© 2020 Spinnaker Investment Group. All Rights Reserved.
Disclosures
|
GET IN TOUCH
949.396.6700
info@spinninvest.com
spinninvest.com
4100 MacArthur Blvd., Ste 120
Newport Beach, CA 92660
|
|
|
|
|
Past performance is not a guarantee of future results. Indices are not available for direct investment. Index performance does not reflect the expenses associated with the management of an actual portfolio. Market segment (index representation) as follows: US Stock Market (Russell 3000 Index), International Developed Stocks (MSCI World ex USA Index [net div.]), Emerging Markets (MSCI Emerging Markets Index [net div.]), Global Real Estate (S&P Global REIT Index [net div.]), US Bond Market (Bloomberg Barclays US Aggregate Bond Index), and Global Bond Market ex US (Bloomberg Barclays Global Aggregate ex-USD Bond Index [hedged to USD]). S&P data © 2019 S&P Dow Jones Indices LLC, a division of S&P Global. All rights reserved. Frank Russell Company is the source and owner of the trademarks, service marks, and copyrights related to the Russell Indexes. MSCI data © MSCI 2019, all rights reserved. Bloomberg Barclays data provided by Bloomberg. The S&P 500 Index is a free-float market capitalization weighted index of 500 of the largest US companies. This index is calculated on a total return basis with dividends reinvested and is not available for direct investment. Charts from Dimensional Fund Advisors. Inflation is typically defined as the change in the non-seasonally adjusted, all-items Consumer Price Index (CPI) for all urban consumers. CPI data are available from the US Bureau of Labor Statistics. Stock is the capital raised by a corporation through the issue of shares entitling holders to an ownership interest of the corporation. Treasury securities are negotiable debt issued by the United States Department of the Treasury. They are backed by the government's full faith and credit and are exempt from state and local taxes. Past performance is no guarantee of future results, and there is always the risk that an investor may lose money. Diversification neither assures a profit nor guarantees against loss in a declining market. The information contained herein is based on internal research derived from various sources and does not purport to be statements of all material facts relating to the securities mentioned. The information contained herein, while not guaranteed as to the accuracy or completeness, has been obtained from sources we believe to be reliable. Opinions expressed herein are subject to change without notice. Charts from Dimensional Fund Advisors and Charles Schwab.
|
|