| CONNECT |
 |
 Truth Hertz
By Morgan Christen CFA, CFP, CDFA, MBA, CEO and CIO Welcome, What a comeback. The first quarter we experienced one of the fastest bear markets on record, 16 days. The second quarter staged an impressive bump forward. From 2015 through 2019 there was not a single daily gain of 4% or more. This year, there has been eight of those moves including five days with 6% or greater gains. |
 |
|
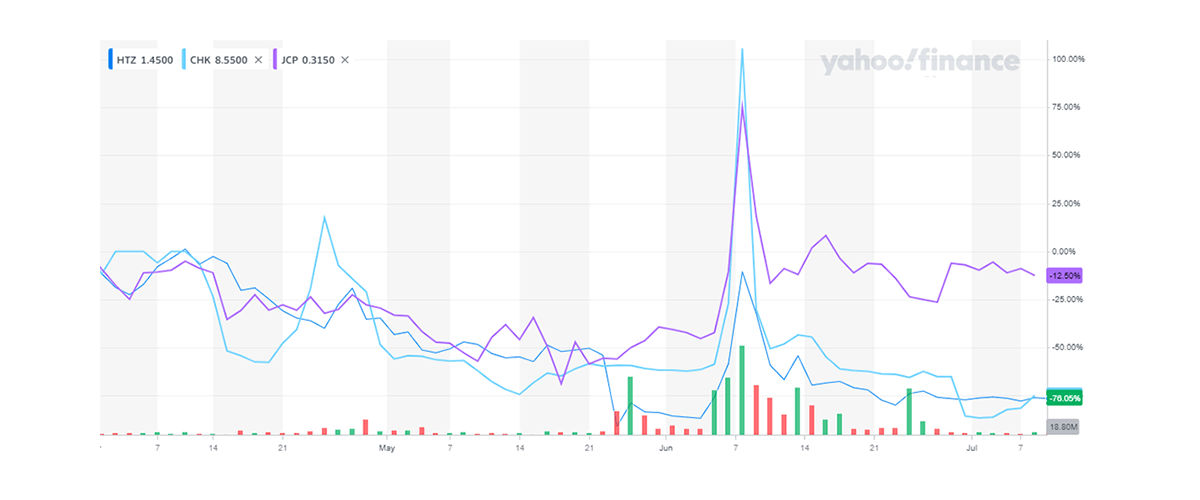
We have also watched the comeback of the day trader. With COVID-19 putting sports on the sidelines, sports betting has shifted to day trading. Reports say this spectacle partially explains the disconnect in the economy and the stock market.
Traders (betters) pushed shares of Hertz, J.C. Penney, and Chesapeake Energy. |
These companies have a tremendous amount of debt and are facing bankruptcy, but that did not stop the action in the firms.
Hertz is sitting on $19 billion of debt of which $11 billion is tied to leased cars; their chance of survival is limited. As quick as they ran-up, they moved back down, leaving some investors whipsawed. My neck Hertz. |
 |
|
Stocks
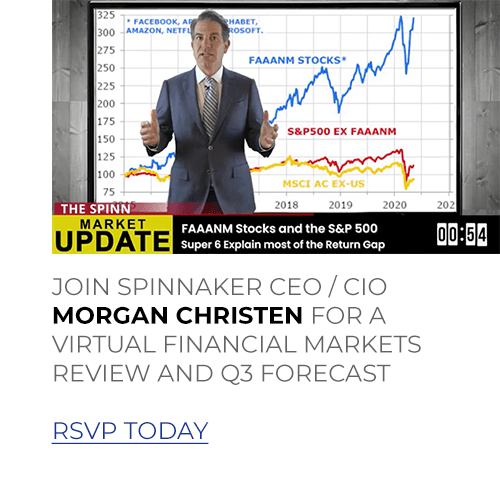
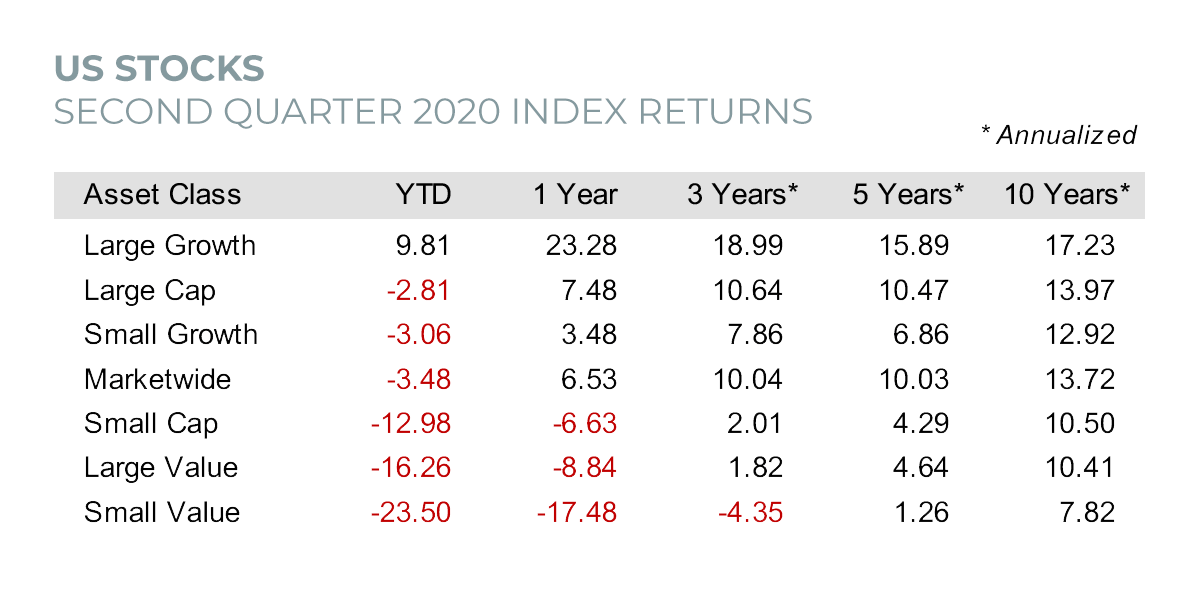
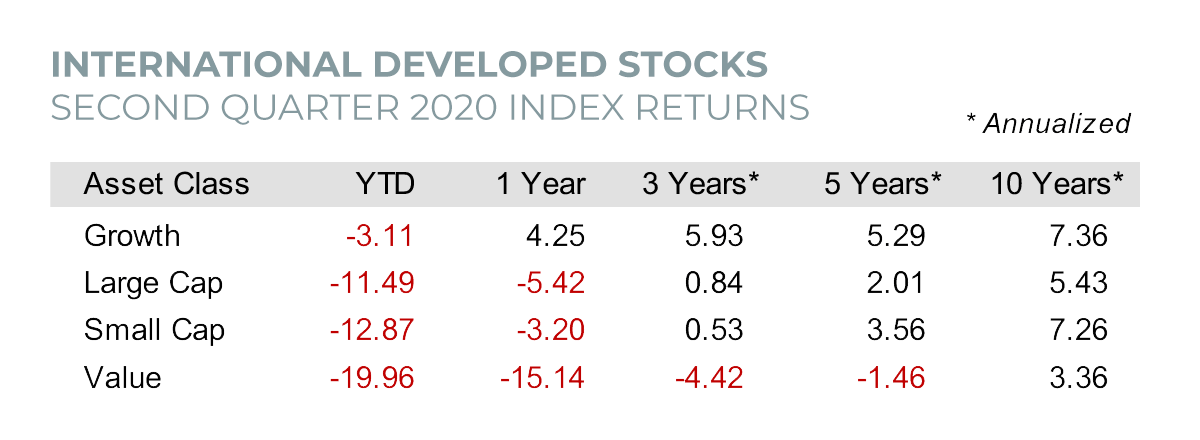
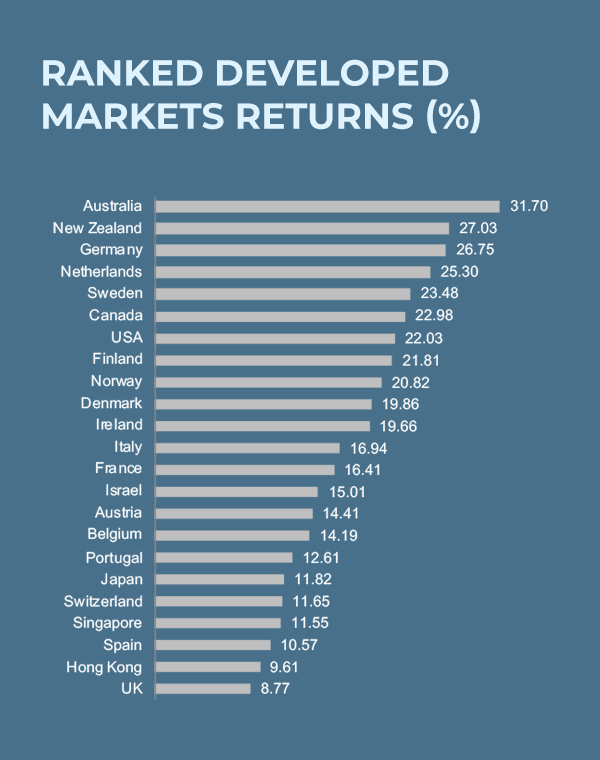
Growth stocks continue to lead the charge. The growth indices are heavily weighted in the large tech names that have continued to defy gravity. Five stocks make up 20% of the S&P 500 - Amazon, Microsoft, Apple, Facebook, and Google (as of 7/9/20 up 65%, 34%, 29%, 18% and 12% YTD respectively). |
The S&P 500 is still down for the year as the bulk of the other stocks remain depressed. Small and value companies have some digging to do to get out of their hole.
We have been adjusting our models to reduce exposure to financial and industrial sectors that tend to show up in the "value" camp. |
 |
|
 |
 |
|
 |
|
Conclusion
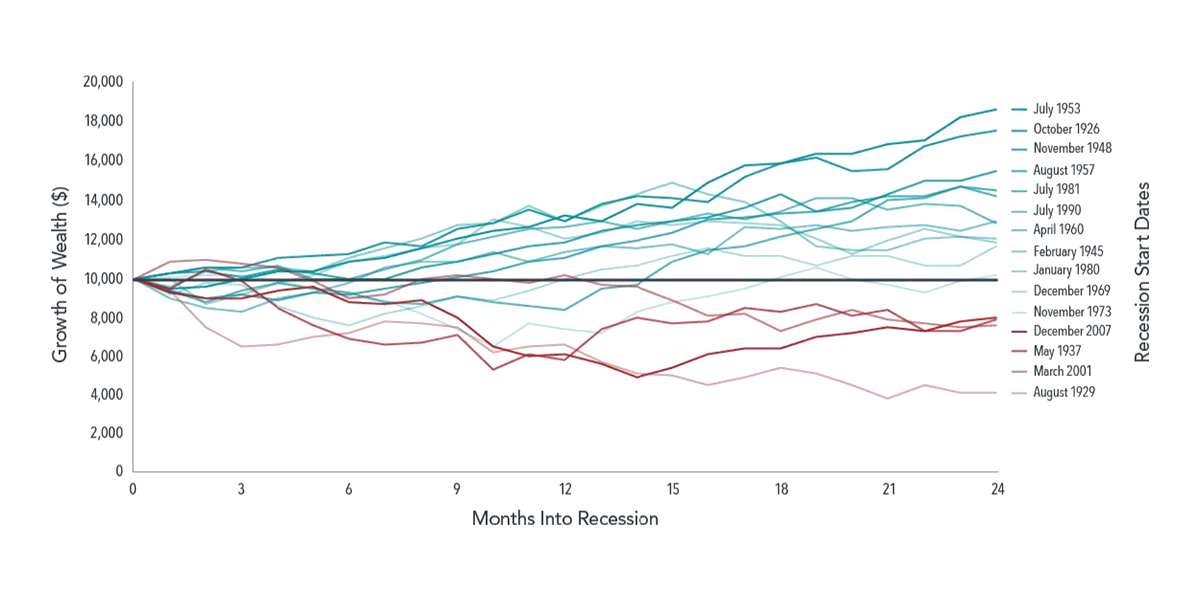
We hear a lot of investors voicing skepticism about the current market. Skepticism is warranted, as the market has moved up rather quickly, 'betters' versus investors are in the market, and the economy stinks. Markets historically have rewarded those who remained invested (see chart). Spinnaker has always been about investing and not betting. |
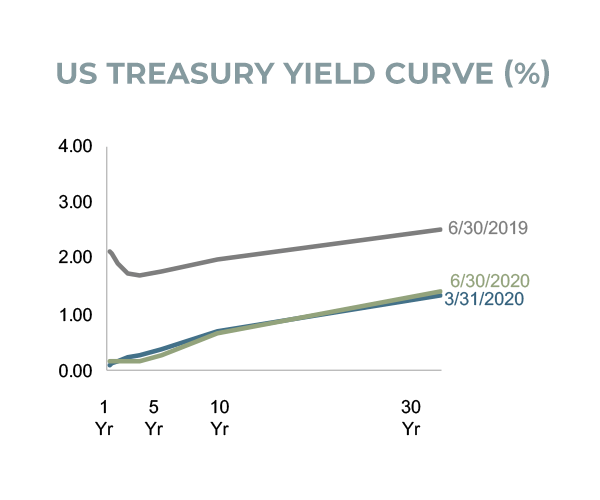
As investors we still see value in some parts of the market, especially with interest rates as low as they are. As many investors who sold in the first quarter now realize, you cannot win if you are not in.
The old Hertz slogan was "let Hertz put you in the driver's seat." We choose to revise that to: "let Spinnaker keep you in the driver's seat." |
|
Have You Taken
The SpinnCycle™? A quick reality check for your portfolio Enter the SpinnCycle and find your SpinnScore™ |
|
| Spinnaker Mobile App now Available for IOS and Android |


|
|
Spinnaker Investment Group is a boutique, family-owned investment advisory firm that helps each investor design, implement and run a portfolio. We work directly with each client to help them realize their financial independence. © 2020 Spinnaker Investment Group. All Rights Reserved. Disclosures |
GET IN TOUCH
949.396.6700 info@spinninvest.com spinninvest.com 4100 MacArthur Blvd., Ste 120 Newport Beach, CA 92660 |
| DISCLOSURES: Past performance is not a guarantee of future results. Indices are not available for direct investment. Index performance does not reflect the expenses associated with the management of an actual portfolio. Market segment (index representation) as follows: US Stock Market (Russell 3000 Index), International Developed Stocks (MSCI World ex USA Index [net div.]), Emerging Markets (MSCI Emerging Markets Index [net div.]), Global Real Estate (S&P Global REIT Index [net div.]), US Bond Market (Bloomberg Barclays US Aggregate Bond Index), and Global Bond Market ex US (Bloomberg Barclays Global Aggregate ex-USD Bond Index [hedged to USD]). S&P data © 2019 S&P Dow Jones Indices LLC, a division of S&P Global. All rights reserved. Frank Russell Company is the source and owner of the trademarks, service marks, and copyrights related to the Russell Indexes. MSCI data © MSCI 2019, all rights reserved. Bloomberg Barclays data provided by Bloomberg. The S&P 500 Index is a free-float market capitalization weighted index of 500 of the largest US companies. This index is calculated on a total return basis with dividends reinvested and is not available for direct investment. Charts from Dimensional Fund Advisors. Inflation is typically defined as the change in the non-seasonally adjusted, all-items Consumer Price Index (CPI) for all urban consumers. CPI data are available from the US Bureau of Labor Statistics. Stock is the capital raised by a corporation through the issue of shares entitling holders to an ownership interest of the corporation. Treasury securities are negotiable debt issued by the United States Department of the Treasury. They are backed by the government's full faith and credit and are exempt from state and local taxes. Past performance is no guarantee of future results, and there is always the risk that an investor may lose money. Diversification neither assures a profit nor guarantees against loss in a declining market. The information contained herein is based on internal research derived from various sources and does not purport to be statements of all material facts relating to the securities mentioned. The information contained herein, while not guaranteed as to the accuracy or completeness, has been obtained from sources we believe to be reliable. Opinions expressed herein are subject to change without notice. First chart courtesy of Yahoo Finance. Hyperlinks will take you to other pages with corresponding information. |